5.2 Lab
Task: Explore the Connections pane#
The app 03_databse/app.R is a Shiny application that reads data from a PostgreSQL database.
The RStudio IDE has a pane for "Connections" that allows you to establish database connections and browse information contained in the database tables.
See these support articles:
As well as the article at db.rstudio.com/
And you can watch this video walkthrough:
Task: Deploy a Shiny app with database connection#
Run the app 03_database/app.R in the IDE to make sure everything works.
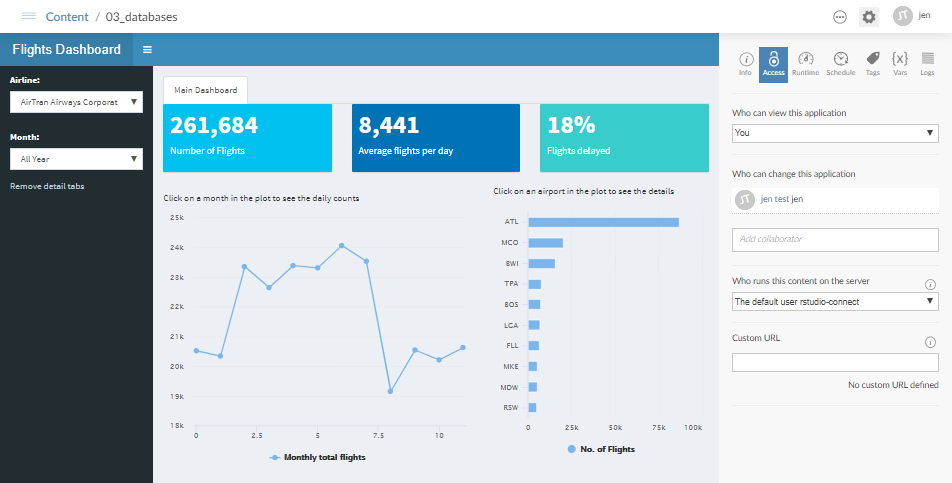
Notice that the connection gets established by this line of R code:
con <- DBI::dbConnect(odbc::odbc(), "Postgres Dev")
Deploy 03_database/app.R to Connect (using the publish button in the Source pane).
While you wait, can you figure out how "PostGres Dev" is defined?
Need a hint?
Try both of the following commands:
cat /etc/odbc.ini
cat /etc/odbcinst.ini
Task: Change runtime settings#
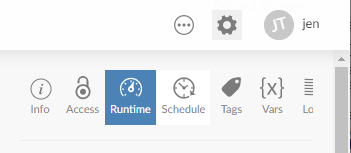
While you're viewing the deployed app in Connect, find the "runtime settings":
The Connect admin guide explains these settings at:
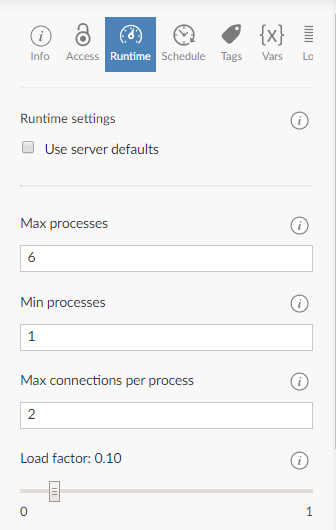
Read this part of the admin guide, then change the settings to allow parallel execution of your app:
| Setting | New value |
|---|---|
| Max processes | 6 |
| Min processes | 1 |
| Max connections per process | 2 |
| Load Factor | 0.1 |
The setting pane looks like this:
Task: Load the app#
- Open the metrics dashboard in a new browser tab
- As an administrator, you can find the "metrics" as a pane in the admin dashboard:
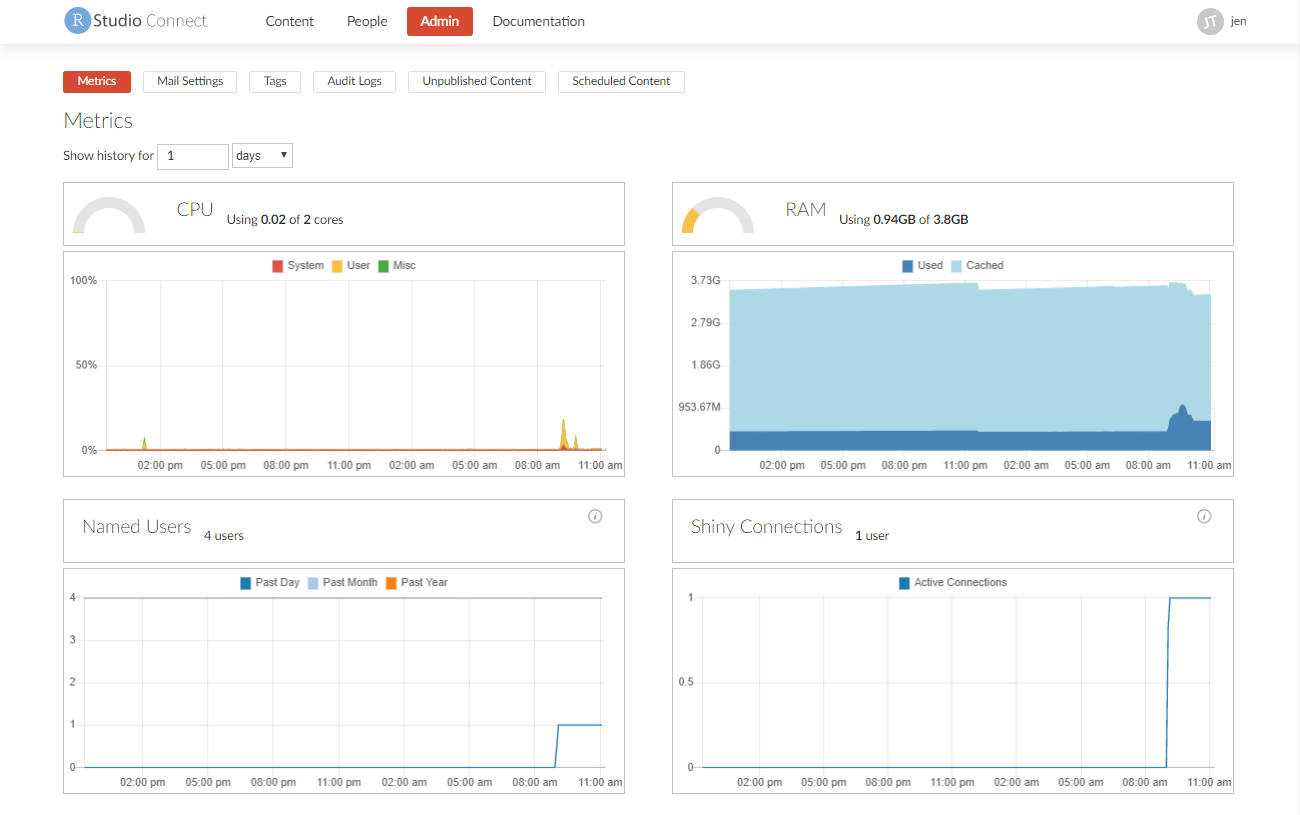
Return to your app, and progressively open the app in 6 new tabs
- Do this by pasting the app URL in 6 new browser tabs
- Each new tab will establish a new connetion to your app.
Notice in this recording how the CPU indicator goes into the red very quickly, as each shiny connection puts a new demand on the database. However, even a 2CPU machine can handle the 6 simultaneous connections, albeit with some delay to the user:
Simulation: shimmer#
Open the Shimmer and shiny simulation app at https://colorado.rstudio.com/rsc/shimmer_and_shiny/
- Read the instructions
- Perform the simulation
- Adjust setting until all the measurements are in the "blue"
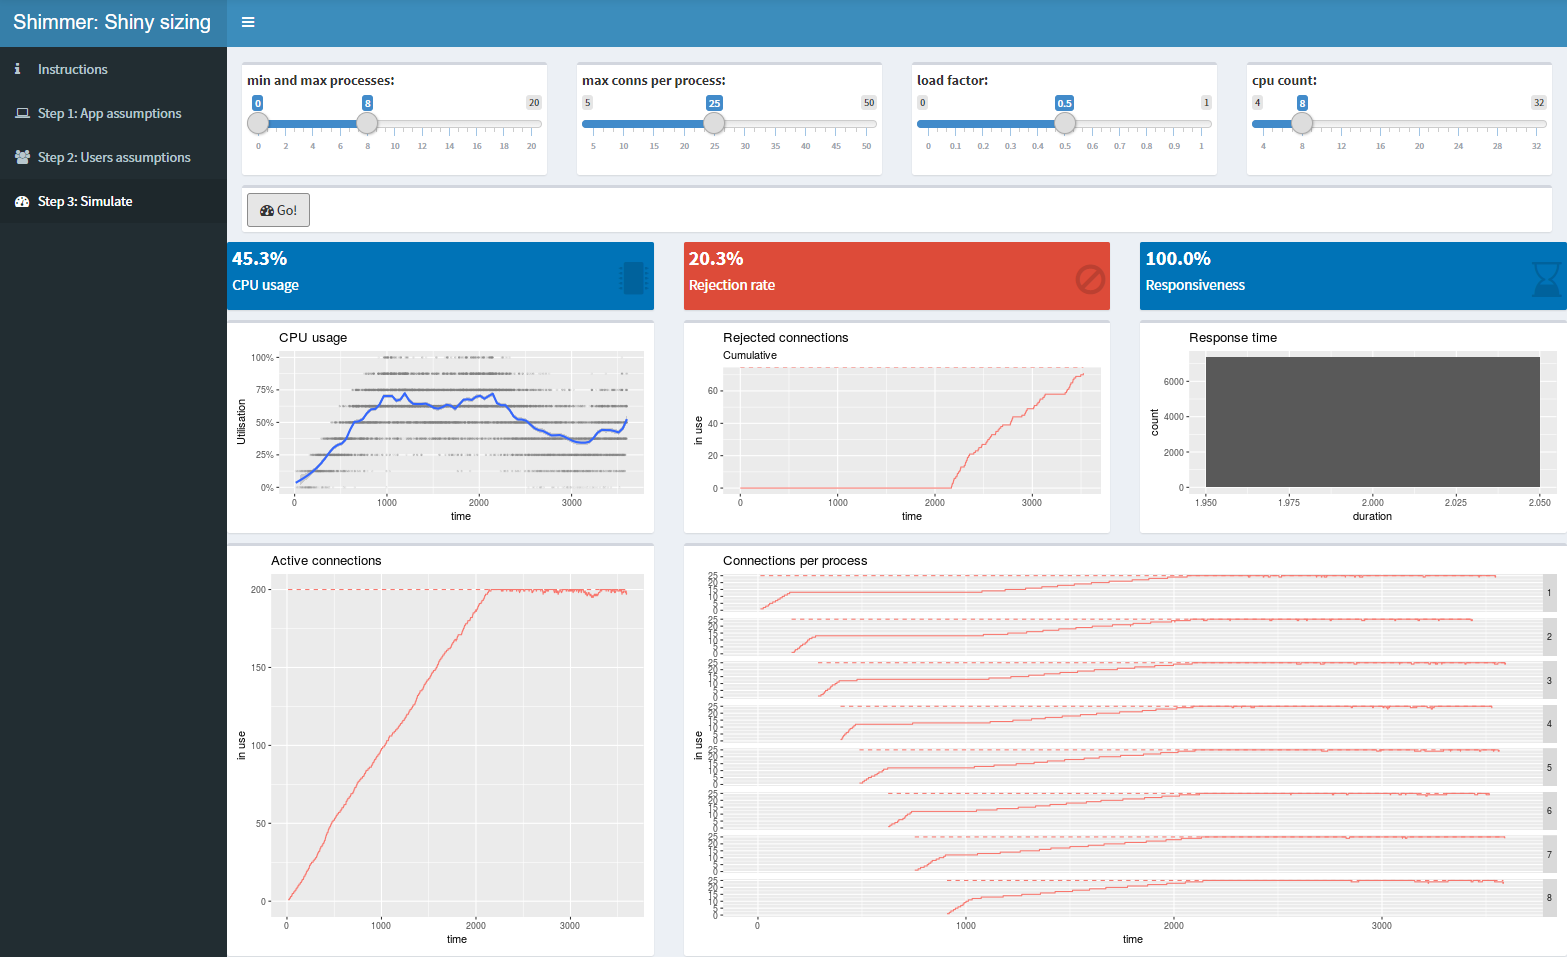
Try to develop an intuitive understanding of the runtime settings.
Ideas to try:
- Increase the number of users
- Increase the number of requests per user
- Increase the app response time
Then modify the server size and runtime settings until all the indicators are in the "blue"